
March 23, 2022
Websites are like gardens. They need regular tending, nurturing, and pruning. And just like you can look at a garden and see droopy plants that need watering or weeds that need pulling — looking at website data will help you stop guessing and know exactly what to do next!
Data can tell you how to adapt your content and design so that your site can rank higher in search, attract more visitors, and more convert customers. And there are many tools out there (some of them are completely free) to help you measure your website’s performance. But which website metrics matter?
Here are 9 website metrics you should be measuring and learning from right now.
1. Number of Visits
Tracking the number of visits will help you understand how website traffic is impacted throughout the year. For instance, you might see spikes in traffic after trade show attendance, email campaign, or publishing an article to your blog. And you might see a slump when you’ve been less active in your marketing efforts.
Sessions data tells you the total number of visits to your site, and Users tell you how many unique visitors you had. Sessions data includes repeat visitors, and Users data tracks repeat visits by a single-use.
Pro Tip: In 2014, Google re-named unique visitors as “Users” and re-named Visitors as “Sessions.”
2. Time on Page
Average time on page is the average amount of time all users spend on a single page. Knowing how long individual pages can hold a visitor’s attention is helpful because it can be an indication of how well your content is working. The longer someone stays on the page, the more likely it is that they are reading your content.
But there are a couple of issues with time on page data – GA does not include bounces (when people visit one page then exit the site) nor exits. Since most sites have a bounce rate higher than 50%, most sites are not getting an accurate data set.
Pro Tip: Get better page and session duration reporting by putting custom event tracking in place.
3. Bounce Rate
Bounce rate is the percentage of single-page website visits, that ended without an interaction. Meaning, they saw one page, and then left without doing anything. But does that mean they didn’t read the page? Not entirely!
Landing pages with very high bounce rates can still have high engagement. If people are visiting a product page, getting what they need, and then bouncing, that’s actually ok. But a high bounce rate could also indicate that you have bad content, a UX problem, or a missing next step. The idea is to note your bounce rate and then ‘look under the hood’ to see if there are any problems.
Pro Tip: Compare bounce rate to time on page to identify if a high bounce rate is illustrating low engagement with your content or a missing next step.
4. New/Returning Visitors
Similar to bounce rate, new vs returning visitors is an important metric to keep track of. While you always want a steady supply of new users visiting your channel (proof of SEO success and potential clients) you have to also be cognizant of the number of returning visitors.
Much like with bounce rate, poor user experience often leads to visitors getting frustrated with your website and not coming back. Common UX fails such as: failing the 3-second rule, ads, outdated/non-intuitive layout, or worst, visitors being unable to figure out how to engage with your sales funnel can cost your business valuable leads and conversions.
Pro Tip: Keep in mind, someone viewing your website incognito/private, views from a different device, or clears their browser cache will count as a new viewer.
5. Pages Per Session
Pages per session data show you how many pages your visitors viewed before they left your site. This metric is related to bounce rate, but it gives you a bit more granular information.
An extremely low bounce rate could give you a false sense of success if you don’t also look at your pages per session. If visitors are only clicking through to one more page before leaving, you’re not giving people the answers they’re looking for. In that case, it might be time to rewrite your content to answer your visitors’ questions and pain points.
On the other hand, a low bounce rate and a high pages-per-session number mean your visitors are getting what they need.
Pro Tip: You can increase your pages per session numbers by having high quality, customer persona-relevant content on each and every page of your website.
6. Total Views
Total views is the number of times a page has been viewed during a set period of time such as monthly, weekly, etc. This metric is a good indication of how easy the page is to find, as well as the quality of content on the page. For instance, blog posts with high page views mean people are finding it and hopefully– reading it.
Pro Tip: Pages with low views might just be hard to find — rewrite your page title or meta description to include keywords and consider optimizing your content with backlinks.
7. Scroll Depth
Scroll depth tells you how far down your page people are scrolling. Heat mapping tools like GoodEgg and HotJar are great ways to see how far people are scrolling. This metric really helps your UX, content, and design folks re-order information on the page to drive the most engagement.
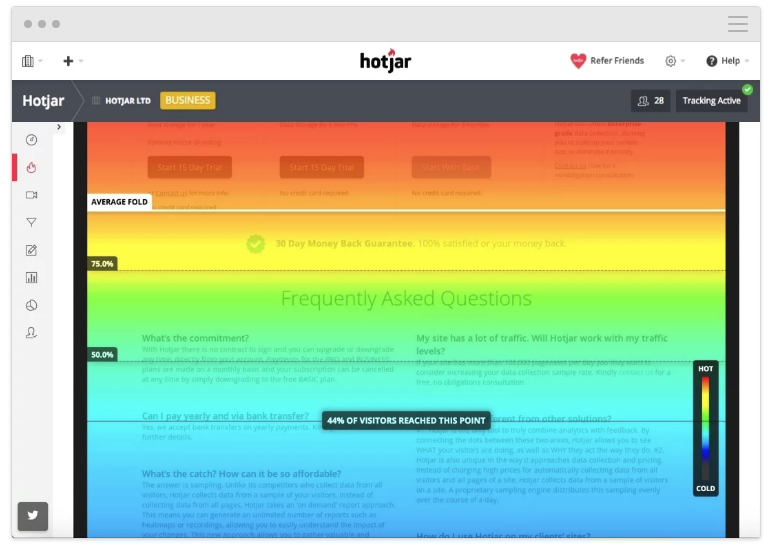
Pro Tip: Put your most important information above the fold! Especially on your homepage.
8. Traffic Sources
Traffic sources tell you how people are coming to your site. Google Analytics, for example, tracks visitors from the following sources:
- Direct
- Organic search
- Referral
- Paid search
- Social and display ads
Understanding where they’re coming from can help you make decisions about advertising spend, understand which channels are working for you, and let you know how you’re doing in search.
Pro Tip: Do an audit of your pages to makes sure they all have tracking codes. If a visitor enters your site on a landing page without a code, and then heads to a second page with a code, GA will report the second page as a start of the session, throwing off your source data.
9. Devices Used
According to Google, 61% of visitors are unlikely to return to a mobile site they had trouble accessing, and 40% visit a competitor’s site instead. Look at website data about which devices your visitors are using so you can stay on top of design and development trends for those devices.
Pro Tip: Test your site across a variety of devices to make sure content stacks neatly and is mobile responsive.
Remember, no one metric by itself tells the entire story. These 9 metrics, combined with others (hey, you’ll get there eventually) will paint a clear picture of what your visitors are doing, where they’re coming from, and what they want — so you can adapt and respond.
Now Do This:
- Measure your website with these 5 Free Analytics Tools
- Subscribe to our blog for more digital marketing tips
- Run your website through HubSpot’s free Website Grader
- Talk to us over a beer about how to improve your website

Get the latest news
Blog Topics
- Analytics
- Branding & Identity
- Budget
- Construction
- Content Marketing
- Conversion Rate Optimization
- Email Marketing
- HubSpot
- Inbound Marketing
- Lead Generation
- Marketing Strategy
- News/Events
- Paid Search & PPC
- Recruiting
- Sales & Marketing
- Sales Enablement
- Search Engine Marketing
- Search Engine Optimization
- Social Media
- Thought Leadership
- Uncategorized
- Usability
- Video Marketing
- Web Hosting
- Website Design